Thursday, February 27, 2014
MS Dynamics AX 2009 & 2012: Basic Understanding of Process Manufacturing in AX...
MS Dynamics AX 2009 & 2012: Basic Understanding of Process Manufacturing in AX...: Basic Understanding of Process Manufacturing In AX Ashish Panth Dated: 26 Feb 2014 Abstract. Prior to wri...
Wednesday, February 26, 2014
Basic Understanding of Process Manufacturing in AX
Basic Understanding of Process
Manufacturing
In AX
Ashish Panth
Dated: 26
Feb 2014
Abstract. Prior to writing this
article, it involved consultation with associated domain experienced
members and it also includes much effort in understanding the comparison
between Discrete and Process Industries. Result of this article is reported to
be the getting clear idea of benefits of Process manufacturing in AX and also
the related terminologies.
Introduction
Process
Manufacturing is the manufacturing industry which deals with the Formulas as
compared to the Discrete Manufacturing industry which deals with the Bill of
materials. Process manufacturing relevant factors are ingredients, not parts; formulas,
not bill of materials and bulk, not individual units.
Process
Industries for Microsoft Dynamics AX enterprise resource planning (ERP)
addresses the needs of life sciences, agri-business, food and beverage,
chemical, pharmaceutical food and beverage industries.
By the help
of AX in process industries, the manufacturers get complete detailed picture of
the entire business in real time.
Process
Industries also includes modules for process manufacturing, process
distribution and total quality management.
It helps
improve operational efficiency by integrating sales, production, inventory,
quality control, distribution, and customer service capabilities throughout the
process manufacturing life cycle so you can better manage all the variables
required to engineer and build products to custom specifications, optimize
capacity, comply with regulatory demands, and drive continuous process
improvement.
Fast decision-making. Monitor inventory across multiple
dimensions, incorporate co-product and by-product management into product
planning, and carefully oversee quality control so you can make informed,
timely business decisions.
Efficient production and delivery. Gain real-time visibility into
relationships between orders, inventory, and distribution to develop production
plans based on capacity and customer demand.
Process
Industries for Microsoft Dynamics AX helps you to improve operational efficiency
and increase product quality while meeting environmental and production safety
requirements and achieving your profitability objectives.
Quick ROI- Process
Industries for Microsoft Dynamics AX is tightly integrated with other Microsoft
products and uses the same interface so you can extend and customize the
capabilities of your solution at an overall low total cost of ownership.
Enhances the Speed and flexibility of
your process manufacturing operations-
Process
Industries for Microsoft Dynamics AX supports the unique requirements of a process
manufacturing operation, including:
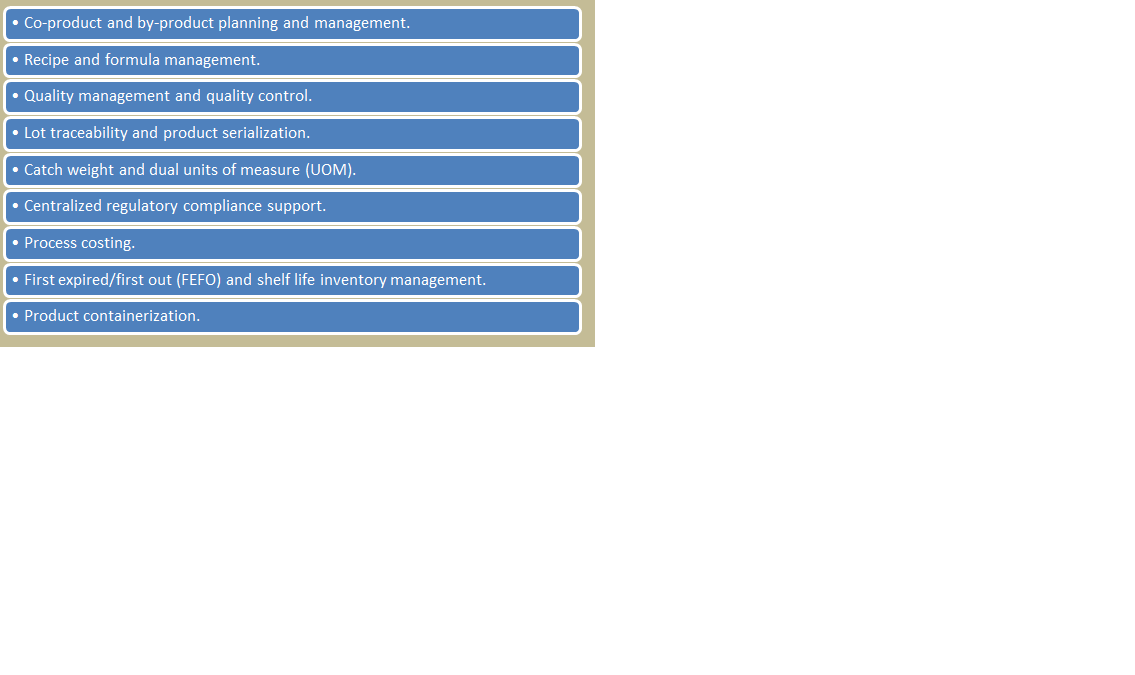 Multi-dimensional inventory -
Process
Industries for Microsoft Dynamics AX helps you to track and manage materials
while taking into account the complexities of multiple inventory
characteristics such as weight, container type, and expiration date.
In addition,
you can define, manage, and cost multiple outputs, including co-products and
by-products, from a single production process. Monitor your inventory in various
dimensions to improve product delivery rates and enhance customer service.
With Process
Industries for Microsoft Dynamics AX, you can define a single product number
and formula for all packaging configurations for an end item to dramatically
simplify product codes. A two-level formula structure enables you to maintain
unique packaging components for each packaging type assigned to the main
formula.
You can even
manage multiple customer orders in various packaging configurations and deliver
products packaged to meet your customers’ precise requirements, right down to
the quality specifications of a specific lot. With the enhanced configuration capabilities
of Process Industries for Microsoft Dynamics AX, you can improve customer
satisfaction and increase your competitive edge.
With Process
Industries for Microsoft Dynamics AX, your employees can share real-time
information about specifications, order status, and QC testing across key departments
to streamline buying, selling, and production decisions. With access to
up-to-date data, managers and employees can make changes and adjustments
quickly and reach informed decisions.
Process
Industries for Microsoft Dynamics AX, you can view and manage information at
the level of detail you need, when you need it. Get a comprehensive view of
overall operations to drive continuous process improvement; or drill down to
individual item availability, shop floor activities, and employee performance
so that you can match quantities and grades of product to specific customer
orders, help ensure on-time deliveries, and manage resources effectively.
Comparison between Formula and Bill of
material
Formula is
used in Process industries while Bill of material in the Discrete industries.

Concept of Co-products
and By-products
As every
process manufacturer knows, production processes can yield materials other than
the planned end item. These additional outputs, called co-products or
by-products, may be reused, sold at a profit, or disposed of at a cost.
Generally, co-products are desirable secondary
outputs from the manufacture of the planned product that can be sold or reused
profitably.

By-products are unavoidable secondary outputs
that may be sellable or usable, or they may be waste that must be disposed of
at a cost.

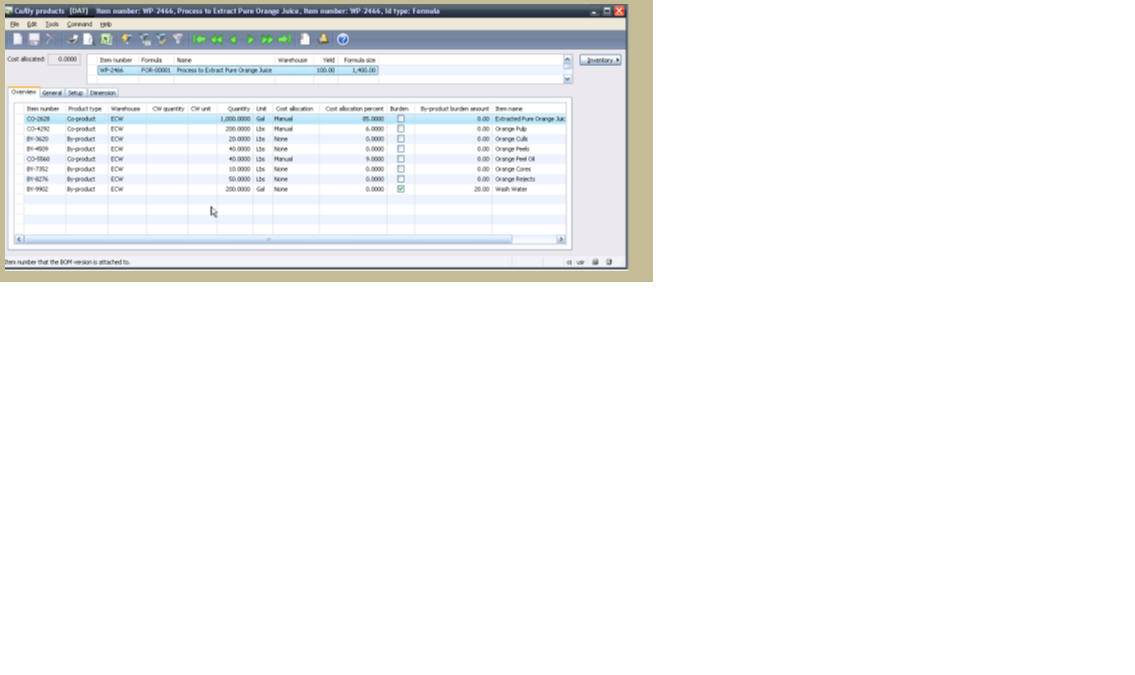
The
following figure below shows the Co/by products form.
 Planning Item in comparison
with Normal Formula
Planning Item in comparison
with Normal Formula
A special
type of Formula item can be created where the outputs of that formula are only
the co-products and optionally, by-products. This type of formula item occurs
when its Product Type is set to Planning Item. A Planning Item will not have
any inventory transactions or exist in inventory. The Planning Item can be
thought of as an artificial grouping of items used to facilitate production,
master scheduling and material planning. Those co-products that are assigned to
the Planning Item’s formula must have 100% of the production costs allocated to
them, which may include any costs associated with the processing of
by-products.

Normal Formula versus
Planning Item Formula-
Different Product Type –
Item with
Type ‘Formula’ is set as a ‘Planning Item’ in the Product Type field on the
References tab of the Item Master. Any other Formula will have Product Type set
to ‘None’.

Normal
Formula is not required to have additional Co/By Products outputs. Planning
Item Formula must have Co-Products outputs.
Normal
Formula item will share costs with its Co-Products but will typically have the
largest allocation of the formula costs. All costs in a Planning Item’s Formula
are allocated to the Co-Products.
Comparison between Process Manufacturing and
Discrete Manufacturing
Material/routing relationship—In a discrete work order system,
materials must be issued in the first operation. In process companies, the
materials are often issued only when they are needed at the operation.
Recycles—BOMs cannot manage recycles well
because a BOM defines a part (or raw material) as either consumed or produced,
but not both. A recycle is an item that is consumed in one operation and
produced in another, so it is both consumed and produced.
Scaling— In some formulations some products
scale while others do not based on the end-item batch size. An example is a
catalyst, in a chemical batch, or a yeast pack in a food example. BOMs have
difficulty flagging non-scalable items.
Percentage-based formulations—Most BOMs are designed using quantity
per equivalents. In some formulations ingredients are issued based on
percentages or hundred weights (baking).
Variable output—Process companies deal with
variability, both on input and output. Because there are sometimes reactions,
yield can be positive or negative. Discrete work orders are designed to produce
fixed quantities based on fixed inputs. Formulations can produce more or less
than was planned, and work orders can be closed long or short. This is a key
differentiator when comparing discrete work order and batch formulations.
Unplanned co-/by-products—often in meat companies, or life
sciences, what was planned on the batch order is not what resulted from
production. The ability to add new, unplanned co- and by-products is another
key difference between discrete work order and process batch orders.
Catch weight items
Catch weight
items are commonly used in industries where items can vary slightly by weight
and/or size, such as the food industry. These items use two units of measure –
an inventory unit and a catch weight unit. The inventory unit is the unit of
measure in which the item is weighed and invoiced. The catch weight unit is the
unit in which the inventory transactions are performed (sold, received,
transferred, picked, shipped, and so forth).
Full or partial visibility
The
dimension configuration and weight you set up for a catch weight item
determines whether the item uses full or partial visibility.
Full visibility requires that each piece of
inventory be assigned a unique serial number and the specific weight of that
inventory identified and recorded. By associating the serial number with the
weight of the inventory, the weight for that piece of inventory is always known
simply by entering the serial number. For example, assume that five pieces of
inventory for a full visibility item are received into inventory. Each piece is
assigned a unique serial number and the weight for that specific serialized
piece is recorded. Once the serial number and weight are established, any
transaction you perform for that particular piece of inventory requires only
the entry of the serial number. The system provides the weight by default.
Partial visibility allows one or more pieces of
inventory to use the same serial number or batch number. Only the aggregate
weight of the inventory is recorded. As a result, the weight of each
transaction must be entered as transactions are performed, since the individual
weight of each piece is not known. For example, a partial visibility catch
weight item consisting of five pieces of inventory is received into inventory.
Each piece received may or may not have serial or batch dimension requirements.
When a transaction involving some or all of this inventory is performed, the
inventory must be weighed and the aggregate weight entered in the system. Only
the aggregate weight for the five pieces is identified and recorded.
Batch attributes
Batch
attributes are characteristics of raw materials and finished goods that make up
inventory batches. In process distribution, batch attributes can differ
depending on a number of factors, such as environmental conditions or the
quality of the raw materials used to produce the batch. The number and types of
batch attributes used can vary widely from one industry to another.
Here are two
examples of batch attributes that might be used by different industries.
In the
cheese industry, milk, which is one of the raw materials used to produce the
cheese, may have attributes such as fat content and percent weight. The cheese
produced from the milk could have other attributes like moisture and age.
In the steel
industry, the iron you produce might have attributes such as the percentages of
magnesium content, silver content, and zinc content.
Packed Items
A packed (or
child) item is an item that has been packaged into either a single container or
multiple containers, both of which are considered one inventory unit. For
example, a 7 gallon pail, an 8 oz. bottle, or a case of 32 oz. bottles of
product is each considered a single packed item unit.
Bulk Items
A bulk (or
parent) item is an item that is consumed by one or more packed items. A bulk
item is reported separately, but it is not normally stocked in inventory on a
permanent basis. It remains in inventory only long enough to be packaged into
one or more packed item containers. While in inventory, a bulk item might be a
parent item to a packed item.
Thursday, February 20, 2014
Concepts of Transfer Journal, Movement Journal , Proft & Loss Journal and Counting Journal
Transfer Journal:
Transfer Journals are used to transfer inventory quantity from one inventory dimension combination to another.
Inventory Management ->Journals ->Item Transaction ->Transfer
It does not include any costing.
It can be used to transfer inventory from
1. One location to another location.
2. One batch to another batch.
3. One variant to another variant
Movement Journal and Proft & Loss Journal:
These journals are used to record item issues or receipts in inventory.
But the difference between these two is of offset accounts.
In case of Movement Journal, while moving inventory you can add cost to an item.Here we have manually add the Ledger account(Not as per the posting profile account setup).

In case of Profit & Loss Journal, while moving invenotry, the cost is automatically added to a particular general ledger as per the item group posting profile setup.

Inventory Counting Journal:
Inventory Management -> Journals ->Item Counting ->Counting
In order to determine, the actual quantity avalaible physically, we will do inventory counting in the warehouse.
We will register the counted quantity in inventory journals. And when we do posting, the system will calculate the difference between the counted quantity and the physical quantity avaliable and will post an item issue/receipt.
We have got 2 options to register inventory counting:
Manual registration and Create counting lines automatically.
Manual registration- We have to enter the counting lines manually. In the Counted column, we need to enter the counted quantity.

To create lines for counting exisiting stock automatically,
we have to click on Create/On- hand, Create /Items or Create/Expired Batches

Wednesday, February 19, 2014
Concepts of Inventory Model Group- AX 2009 / Item Model Group -AX 2012
Here i am going to discuss about the basic understanding of Inventory Model Groups/Item Model Group.
The first and the main purpose of the Inventory model group/Item Model Group is to set up the rules for calculating of item cost.


Let’s assume that a shopkeeper purchases 6 items for the cost of Rs 50 and 4 items for the cost of Rs 55. So, the total items’ cost is 6*50 + 4*55. The company sells 4 items.
Now, there are 6 + 4- 4 = 6 items in the company warehouse.
So the possible cost of item remained in the warehouse are:
Possible Combinations:
- (6 - 4) * 50 +
4 *55
= Rs 320 (the company has sold 4 items that cost Rs 50)
- (6 - 2) * 50 + (4 - 2 ) *55 = Rs 310 (the company has sold 2 item that costs Rs 50 and 2 item that costs Rs 55)
There will other varaints like 1 from Rs 50 and 3 from Rs 55, 3 from Rs 50 and 1 from Rs 55,etc.
We cannot come to the point exactly about the item's cost that is remaining in the warehouse because we only know that there are 6 items remaining in the
warehouse and we don’t know which items are sold.
We can set up the following
rules for an inventory models to calculate item’s cost:
FIFO – First in First out. Means that the first purchased item is first sold.
So in our case, shopkeeper has 6 items for the cost of Rs 50 first, so these
items will be first sold. After the items are sold, the items’ cost in the
warehouse will be (6 - 4) * 50 + 4 * 55 = Rs 320
LIFO
– Last in First out. Meaning that the first purchased item is last sold.
So in our case,shopkeeper has purchased 4 items for the cost of Rs 55 last, so these
items will be first sold.
After the items are sold, the items’ cost in the
warehouse will be 6 * 50 + (4 – 4) * 55 = Rs 300
Weighted avg.
– in this case, the average cost is calculated and subtracted from the
warehouse items’ cost when the item is sold.
So in our case,shopkeeper has average
cost is (6* 55 + 4 * 50) / 10 =Rs 53 .
After the items are sold, the items’
cost in the warehouse will be (10 – 4) * 53 = Rs 318
Standard cost
– this inventory model uses a specific price as cost. The price can be
entered manually or calculated automatically. This price is used as cost
for purchase and selling.
For example, if the shopkeeper has set the standard cost price of
Rs 49. So, we purchase all items for this price Rs 49.
The total items’
cost before the selling is 6 * 49 + 4* 49 = 490. After 4 items are
sold, the items’ cost in the warehouse will be (10 - 4 )* 49 = 294.
LIFO date
– this model equals to LIFO with the only difference being that purchase
and selling dates are taken into account.
For example, a company purchases
four items for the cost of Rs 50 on 11th Jan, three items for the cost of
Rs 55 on 11th Jan and two items for the cost of Rs 47 on 13th Jan.
The
company sells two items on 11th Jan, but the Sales manager was out of
office and didn’t post the sales. The Sales manager came back to the
office on 13th Janand posted the sales backdate to 11th Jan.
The sales
posting process will decrease the cost of items in the warehouse at 2 * 55
(item’s last cost as of 11th Jan).
If the LIFO inventory model is used,
the sales process will decrease the cost of items in the warehouse to 2*47
(because 7$ is the last cost received into the warehouse).
Weighted avg.
date. – this model equals to the Weighted avg with the only
difference being that the average amount is calculated for a separate day.
For example, a company purchases four items for the cost of Rs 50 on 11th Jan, three items for the cost of Rs 55 on 13th Jan and two items for the
cost of Rs 47 on 13th Jan.
The company sells two items on 13th Jan. The
average cost price will be (3* 55 + 2 * 47) / (3 +2) = Rs 259 .
Note : 4 items at the price of Rs 50 are not included in the average cost price
calculation because they have been purchased on another day.
Concepts of On hand Inventory
Dynamics AX gives you in depth information about the inventory items.
It gives you a clear picture about what is in stock, what is reserved, what is ordered and what has been posted /still in transaction.
Inventory Management->Common Forms->Item details->On hand button
OR
Sales Order/ Purchase Order/Inventory Movement/Production Order under Inventory button->On Hand

A. Physical Inventory- It shows you the total avaliable quantity
B. Physical Reserved- It shows the quantity that is reserved in Sales Order.
C. Avaliable Physical -It shows the actual quantity that is avaliable for transactions. It is calculated by subtracting Physical Reserved from Physical Inventory.
C = A - B
D. Ordered in total- It shows the total qty that is open in Purchase order(yet to be received)
E. Ordered Reserved- It shows you the quantities reserved from purchase orders(yet to be received).
F. Avaliable for reservation- It shows you the quantities in open purchase orders avalaible for reservation(yet to be received).
It is calculated by summation of Avaliable Physical with qty left after subtracting Ordered Reserved from Ordered in total.
F = C+ ( D -E )
G. On order in total- It shows you the quantity in open sales order(yet to be delivered)
H.Total Avaliable - It shows you the net avaliable physical quantities for transaction.
It is calculated by subtracting Onorder in total from Available for reservation.
H = F - G
I. Posted Quantity - It shows you the quantity posted financially.
J. Deducted -It shows you the quantities have physical packing list posted in Sales order.
K. Picked -It shows you the quantities have picking list posted in Sales order.
L. Received- It shows you the quantities have physical updated in Purchase order.
M. Registered- It shows you the quantities registered in Purchased order.
N. Physical Cost Amount- It shows you the amount posted in ledger physically.
O. Financial Cost Amount- It shows you the amount posted in ledger financially.
P. Cost Price-It shows you the item average cost.
It gives you a clear picture about what is in stock, what is reserved, what is ordered and what has been posted /still in transaction.
Inventory Management->Common Forms->Item details->On hand button
OR
Sales Order/ Purchase Order/Inventory Movement/Production Order under Inventory button->On Hand
A. Physical Inventory- It shows you the total avaliable quantity
B. Physical Reserved- It shows the quantity that is reserved in Sales Order.
C. Avaliable Physical -It shows the actual quantity that is avaliable for transactions. It is calculated by subtracting Physical Reserved from Physical Inventory.
C = A - B
D. Ordered in total- It shows the total qty that is open in Purchase order(yet to be received)
E. Ordered Reserved- It shows you the quantities reserved from purchase orders(yet to be received).
F. Avaliable for reservation- It shows you the quantities in open purchase orders avalaible for reservation(yet to be received).
It is calculated by summation of Avaliable Physical with qty left after subtracting Ordered Reserved from Ordered in total.
F = C+ ( D -E )
G. On order in total- It shows you the quantity in open sales order(yet to be delivered)
H.Total Avaliable - It shows you the net avaliable physical quantities for transaction.
It is calculated by subtracting Onorder in total from Available for reservation.
H = F - G
I. Posted Quantity - It shows you the quantity posted financially.
J. Deducted -It shows you the quantities have physical packing list posted in Sales order.
K. Picked -It shows you the quantities have picking list posted in Sales order.
L. Received- It shows you the quantities have physical updated in Purchase order.
M. Registered- It shows you the quantities registered in Purchased order.
N. Physical Cost Amount- It shows you the amount posted in ledger physically.
O. Financial Cost Amount- It shows you the amount posted in ledger financially.
P. Cost Price-It shows you the item average cost.
Subscribe to:
Comments (Atom)